0DTE Breadth Indicators and Futures Direction
How 0DTE options breadth signals can predict futures direction. Use put/call ratios and options breadth to forecast explosive ES and NQ intraday momentum.
Breadth Divergences
Track underlying options flow to front-run major futures breakouts.
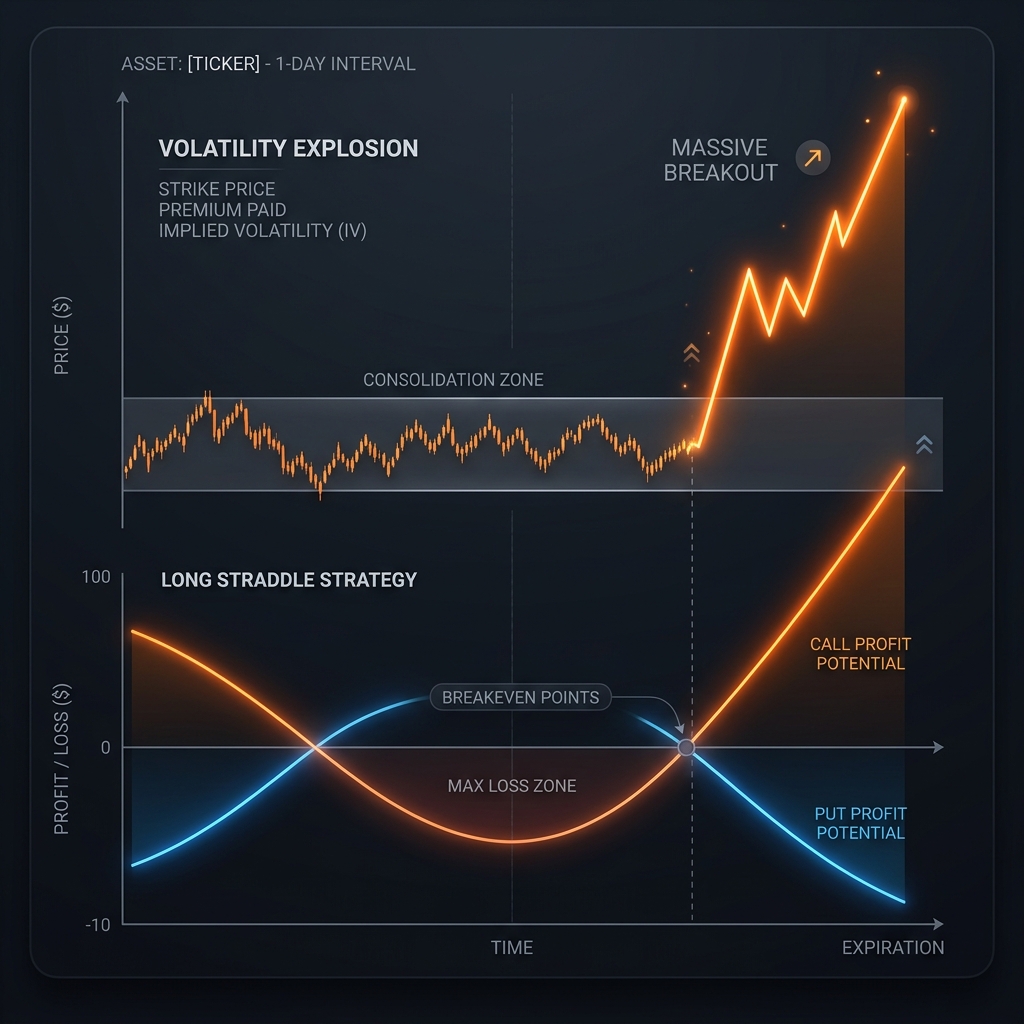
Options Breadth as a Directional Signal
For decades, traditional equity traders have used market breadth indicators like the Advance/Decline line or the TICK index to gauge the underlying strength of the stock market. However, for a modern intraday futures trader navigating the zero-days-to-expiration (0DTE) landscape, traditional equity breadth is too slow.
To predict the immediate, minute-by-minute direction of the E-mini S&P 500 (ES) or Nasdaq 100 (NQ), you must look under the hood of the derivative that now controls the market: 0DTE options breadth.
0DTE options breadth is the real-time, quantitative measurement of the distribution of Call options versus Put options being traded on the SPX or NDX for that specific day’s expiration. It provides a direct X-ray into institutional sentiment, hedging requirements, and speculative retail positioning. When options breadth diverges from the current futures price action, it acts as a powerful leading indicator for violent reversals or explosive breakouts.
The Core Breadth Metrics
To weaponize options breadth for futures scalping, you must track three primary metrics in real-time.
1. The 0DTE Put/Call Ratio (PCR)
The traditional Put/Call Ratio is calculated by dividing the total volume of puts traded by the total volume of calls. However, standard PCR includes contracts expiring months or years from now, rendering it useless for intraday scalping.
You must isolate the 0DTE-specific PCR.
- The Baseline: A 0DTE PCR hovering around 1.0 indicates a balanced market, usually leading to range-bound, mean-reverting price action in the ES.
- The Contrarian Signal: Retail traders are notoriously bad at timing intraday crashes. If the ES drops 10 points and the 0DTE PCR spikes aggressively to 1.8 or higher, it means the market is panic-buying puts. Market makers, who are selling those puts, must buy ES futures to hedge their Delta risk. This massive structural buying pressure often triggers a violent “V-shape” short squeeze, providing a highly lucrative long entry for the contrarian futures trader.
2. Call & Put Premium Delta (Dollar Flow)
Volume alone can be deceiving. Ten thousand OTM (Out-Of-The-Money) penny options can skew the PCR but have zero actual impact on market maker hedging.
Instead, professional traders track Premium Delta, which measures the actual dollar value flowing into the bid/ask spread.
- Positive Premium Delta: More dollars are aggressively hitting the ask to buy calls (or hitting the bid to sell puts). This signifies true, conviction-based bullish flow.
- Negative Premium Delta: Dollars are heavily flowing into buying puts.
- The Scalp Setup: If the ES futures are consolidating sideways in a tight flag, but the Call Premium Delta is surging positively on the tape, the options market is aggressively positioning for a breakout. The futures trader can front-run the technical breakout by entering long before the chart physically breaks the resistance level.
3. Strike Concentration (The Wall)
Breadth must also be analyzed geographically on the options chain. Where is the volume concentrated? If 80% of the daily call volume is heavily concentrated at the 5200 strike price, that level becomes a massive structural magnet (and subsequent resistance wall) for the ES. Understanding the spatial distribution of breadth allows a futures trader to set hyper-accurate take-profit targets.
Trading the Breadth Divergence
The absolute most profitable setups occur when the ES futures price action is lying, and the options breadth exposes the truth. We call these Breadth Divergences.
The Bullish Divergence (The Trap)
The ES futures gap down at the open and spend the first hour slowly bleeding lower. The chart looks disastrous, and breakout algorithms are signaling short entries. However, your 0DTE breadth dashboard shows that despite the dropping price, the Put/Call Ratio is steadily dropping from 1.2 to 0.8, and Call Premium Delta is turning positive.
What is happening? Institutions are quietly buying the dip using options while letting retail panic-sell the futures. The Play: The futures trader ignores the bearish chart, waits for a micro-reversal pattern (like a 1-minute hammer candle), and goes long. The ensuing short-squeeze rally is often the most aggressive move of the day.
The Bearish Divergence (The Exhaustion)
The ES breaks above the morning high, triggering a wave of retail FOMO buying. The futures chart is printing giant green candles. However, the options breadth shows that Call Premium is drying up, and a massive wall of 0DTE Put volume is hitting the tape.
What is happening? The rally is exhausted. Smart money is buying cheap puts at the top to protect their gains or initiate short positions, anticipating an immediate rejection. The Play: The futures trader scales into a short position just above the technical resistance, knowing the options flow does not support the breakout. When the algorithmic buying stops, the ES collapses back into the range.
Combining Breadth with Technical Analysis
It is critical to understand that options breadth is a contextual tool, not an absolute mechanical trigger. You cannot simply blindly buy ES every time the Put/Call ratio drops below 0.8.
Breadth gives you the “Why” and the “Direction,” but traditional Technical Analysis (TA) gives you the “Where” and the “Risk.”
- Identify the Battlefield: Use Volume Profile, VWAP, or major Fibonacci levels on the ES chart to identify where a reaction is likely to occur.
- Read the Flow: As the price approaches that technical level, look at your 0DTE breadth indicators. Are options traders aggressively positioning for a breakout, or are they fading the move?
- Execute with Precision: If the breadth confirms the technical setup, you enter the trade with a significantly larger edge and higher conviction. You place your stop loss based on the technical chart structure, not the options data.
The Danger of the Gamma Flip
When relying on breadth, traders must be acutely aware of the “Gamma Flip” or the Zero-Gamma level. This is the precise price point where market makers transition from being net-long Gamma (where they trade against the trend, suppressing volatility) to net-short Gamma (where they trade with the trend, accelerating volatility).
If the ES price crosses into negative Gamma territory, a high Put/Call ratio is no longer a contrarian buy signal. In a negative Gamma environment, heavy put buying forces market makers to aggressively short futures, creating a self-fulfilling cascade. What looks like a “rubber band stretched too far” becomes a total market capitulation. A futures trader must ensure they are on the correct side of the Gamma line before fading extreme breadth signals.
Conclusion: Trading the X-Ray
Trading ES or NQ futures using only a candlestick chart is like trying to diagnose a broken bone by looking at the skin. 0DTE options breadth provides the X-ray. It reveals the underlying structural pressures, institutional positioning, and market maker hedging requirements that actually drive the ticks on your chart. By mastering these breadth indicators, you elevate your scalping strategy from reactive technical analysis to predictive structural trading.
The Institutional Edge: Decoding Market Maker Positioning
Retail traders often focus exclusively on price charts, technical indicators, and moving averages. However, in the realm of 0DTE options, price action is merely a symptom of a much larger underlying structure: Dealer Positioning.
Institutional options dealers (market makers) are obligated to take the other side of your trades. When you buy a call, they are short that call. To remain delta-neutral and protect their massive portfolios, these dealers must constantly buy and sell the underlying futures (ES or NQ) to hedge their options exposure.
Understanding Gamma Squeezes
When market makers are caught with “negative gamma” (meaning they are short options that are rapidly moving into the money), they are forced to buy the underlying futures as the market rises, or sell as it falls. This forced buying/selling accelerates the trend, creating a Gamma Squeeze.
Negative Gamma Regimes
In these environments, dealer hedging accelerates market moves. Volatility expands, intraday swings become violent, and momentum strategies (like buying breakouts) thrive.
Positive Gamma Regimes
In these environments, dealers trade against the trend (buying dips, selling rips) to stay neutral. Volatility compresses, the market chops sideways, and mean-reversion strategies thrive.
Advanced Risk Management for Index Futures
Trading 0DTE options on index futures is inherently leveraged. Without a strict, mathematically defined risk management framework, an account can be liquidated in a single afternoon.
The 1% Rule
The foundational rule of professional intraday trading is the 1% rule. Never risk more than 1% of your total account equity on a single 0DTE trade setup. If you have a $10,000 account, your maximum acceptable loss per trade is $100.
Defining Risk in 0DTE
If you are buying premium (long calls/puts), your risk is naturally defined by the premium paid. However, if you are selling premium (credit spreads), your risk is the width of the spread minus the credit received. Always calculate your absolute max loss before clicking the buy button.
Sequential Stop Losses
Professionals do not use static stop losses on 0DTE options because the premium fluctuates too wildly due to Gamma and Vega expansion. Instead, they use structural stops based on the underlying futures price. If ES breaks a critical support level, the option is immediately liquidated, regardless of its current P&L percentage.
The Psychology of Intraday Leverage
The primary reason traders fail in the 0DTE futures space is not a lack of technical knowledge; it is a breakdown in psychological discipline.
The Dopamine Trap
0DTE options provide immediate feedback. Within 15 minutes, you can be up 50% or down 50%. This creates a dopamine feedback loop identical to casino gambling. When a trader hits a massive 300% winner, their brain rewires itself to seek that exact high again, leading to over-leveraging and abandoning proven strategies.
Revenge Trading
After a sharp loss, the instinct is to immediately double the position size on the next trade to “make it back.” This is the fastest way to blow an account.
Fear of Missing Out (FOMO)
Watching the market trend 50 points without you causes immense psychological pain. Entering a trade late simply because it is moving usually results in buying the exact top.
Comprehensive FAQ: 0DTE Futures Trading
Why trade 0DTE on Futures instead of SPY?
Futures options (like ES and NQ) enjoy Section 1256 tax treatment (60% long-term / 40% short-term capital gains) in the US, providing massive tax advantages over SPY. Additionally, futures offer deep overnight liquidity and avoid Pattern Day Trader (PDT) rule restrictions.
What is the best time of day to trade 0DTE?
The highest probability setups occur between 9:45 AM (after initial volatility settles) and 11:30 AM EST, and again during the “Power Hour” from 3:00 PM to 4:00 PM EST. The midday session is typically choppy and dangerous due to heavy theta decay.
How much capital is required?
While some brokerages allow micro-futures trading with just $500, a professional account should have a minimum of $5,000 to safely absorb intraday drawdowns and size positions correctly (using the 1% rule).
Do I need Level 2 data?
While traditional Level 2 (order book) data is helpful, institutional derivatives data (GEX, Max Pain, options order flow) is significantly more important for 0DTE trading, as options market makers dictate intraday index pinning.
To further refine your strategy, consider comparing this approach with the 0DTE Intraday IV Crush and Futures Scalping or exploring the mechanics behind Using 0DTE Options Data to Trade ES Futures. Everything ties back into the foundational concepts available in our 0DTE for Futures Hub.
If you want to visualize these market forces live, check out the 01DTE dashboard.
Ready to Master Breadth Indicators and Futures Direction?
Stop guessing and start executing with precision. Join our community of professional traders and get access to real-time gamma levels, flow analysis, and institutional-grade trading tools.
Start Trading NowDisclaimer: This content is for educational purposes only. Not financial advice. Options trading involves substantial risk. Consult a licensed financial advisor before trading. Full disclaimer
Related Articles
0DTE Butterfly Spread
Learn the 0DTE butterfly spread — a low-cost, defined-risk strategy that profits from low volatility and precise price targeting.
0DTE Dashboard Tools Compared
Compare the best 0DTE dashboard tools for real-time market analysis. GEX, max pain, IV, and flow analysis tools head-to-head.
0DTE Strangle Strategy
Learn the 0DTE strangle — a cheaper alternative to straddles. Buy OTM options to profit from large moves while reducing premium costs.
0DTE Straddle Strategy
Master the 0DTE straddle for volatility plays and breakout trading. Learn the difference between [strangle](/strategies/0dte-strangle/) and straddle strategy, and when to deploy them.
0DTE Intraday IV Crush and Futures Scalping
Capitalize on intraday IV crush in 0DTE options for futures scalping opportunities. Discover how volatility compression creates highly predictable futures patterns.
About the Author
Raheel Nawaz
Subject Matter ExpertOptions trader and educator specializing in 0DTE strategies with over a decade of experience in short-dated options and futures markets.